Extra exercises for Chapter 8
Exercise 1: Changes in the high school dropout rate
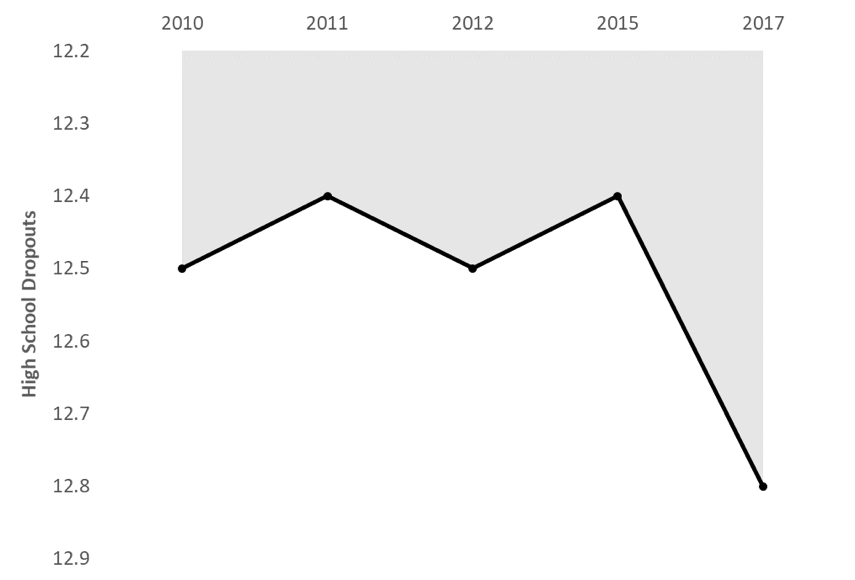
You work for an education advocacy organisation. Your colleague produces the following chart, which they say demonstrates a recent dramatic increase in the percentage of students who are dropping out of full-time education before the age of 16:
There are several problems with this chart. What are they?
Exercise 2: How prison works
Howstuffworks.com is a website which aims to provide easy-to-follow explanations of how the world works, from political procedures to supernovas.
Here is a chart from their explanation of how prison works, based on data from a 1994 US Department of Justice study of recidivism:
Follow
this link and scroll down to view the chart titled ‘How Prison Works’, based on data from a 1994 US Department of Justice study of recidivism.
1. What type of chart is this?
2. Are there any problems with this chart? If so, what are they?
3. Do you think there is better way of representing the data contained in this chart? If so, use the numbers given in the chart to produce a more suitable visualisation.
Exercise 3: Comparing the ages of Best Actor and Best Actress winners
Here you will find a dataset which contains data on acting Oscars (best actor and actress, and best supporting actor and actress) going back to the first ever Academy Awards ceremony in 1928.
Your task is to use this dataset to produce a visualisation showing (separately) the age of best actor and best actress winners over time.
1. Do best actor winners tend to be younger or older than best actress winners?
2. Has this difference changed over time?
NOTE: In 1932, actor Fredric March received only one more vote than another nominee, Wallace Beery. Under the rules in force at the time, the award was therefore considered a tie and both men received the Best Actor award. A similar event occurred in 1968, when Katharine Hepburn and Barbra Streisand received exactly the same number of votes for Best Actress.
In the dataset, there are therefore two winners for each of these years. You will have to decide how to handle this when producing your visualisation.