johndoe@gmail.com
The gender pay gap analysis reported in Chapter 10 is based on data from the 2016 UK Annual Survey for Hours and Earnings (ASHE). This data is available from the UK Office for National Statistics (ONS) website here .
The first set of figures in the chapter are all based on the ‘All Employees’ spreadsheet (ASHE Table 1) . At the time this chapter was written, only the 2016 provisional results were available. These can be downloaded here . However, if you want to update the analysis, the 2017 provisional results are now available here .
When you download the data, you will see that ‘Table 1’ is actually a zip file containing 22 Excel files (Total table 1.1a down to 1.11b).
Mean average annual earnings of all employees
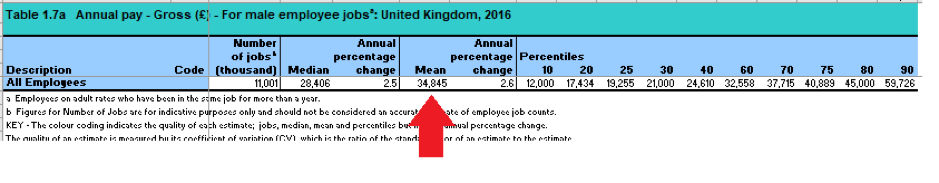
The first set of figures referenced in Chapter 10 are the mean average annual earnings of men (£34,845) and women (£21,671). These can be found in Total Table 1.7a (Annual pay – Gross 2016). If you open this spreadsheet you will see it contains quite a few sheets. The sheets we want are the ones labelled simply ‘Male’ and ‘Female’.
If you click on the ‘Male’ sheet, you will see the mean value the chapter references:
The same goes for the Female sheet.
Mean average hourly earnings of people working full-time
The next set of figures are the mean average hourly earnings of men and women who are working full time, which are £17.34 and £14.94, respectively.
These can be found in Total Table 1.5a (Hourly pay – Gross 2016) in the ‘Male Full-Time’ and ‘Female Full-Time’ sheets, respectively.
Median average hourly earnings of people working full-time
The next set of figures are the median hourly earnings of men and women working full-time (£14.25 and £12.84, respectively). These figures can be found in the same sheets as the mean figures.
Median hourly earnings for male and female bookshop workers
These figures are from ASHE Table 16 (Industry: 4 digit SIC) . Again this is the 2016 provisional data.
Again, ‘Table 16’ is a zip file containing 22 Excel files. The bookshop workers figures are contained in Occupation SIC07 Industry 16.5a (Hourly pay – Gross 2016). Go to the Male/Female Full-Time sheets in this file and search for ‘Retail sale of books in specialised stores’ (code 4761).
Median hourly earnings for male and female CEOs
These figures are from ASHE Table 14 (Occupation: 4 digit SOC) . Again, the chapter uses the 2016 provisional data.
Once again ‘Table 14’ is zip file of 22 Excel files. The CEO figures are contained in Occupation SOC10 (4) Table 14.5a (Hourly pay – Gross 2016). Navigate to the Male/Female Full-Time sheets in this file and search until you find ‘Chief Executives and Senior Officials’. There are two rows with this name. The figure referenced in the chapter is from the one with the code ‘1115’. This is more specific to CEOs than the more general category (code 111).
Table 10.1
This table shows a selection of occupations and industries taken from the 2-digit (rather than 4-digit) SIC and SOC data. The specific files and spreadsheets are as follows:
Occupation : ASHE Table 2 (Occupation: 2 digit SOC) . Table 2.5a
Industry : ASHE Table 4 (Industry: 2 digit SIC) . Table 4.5a